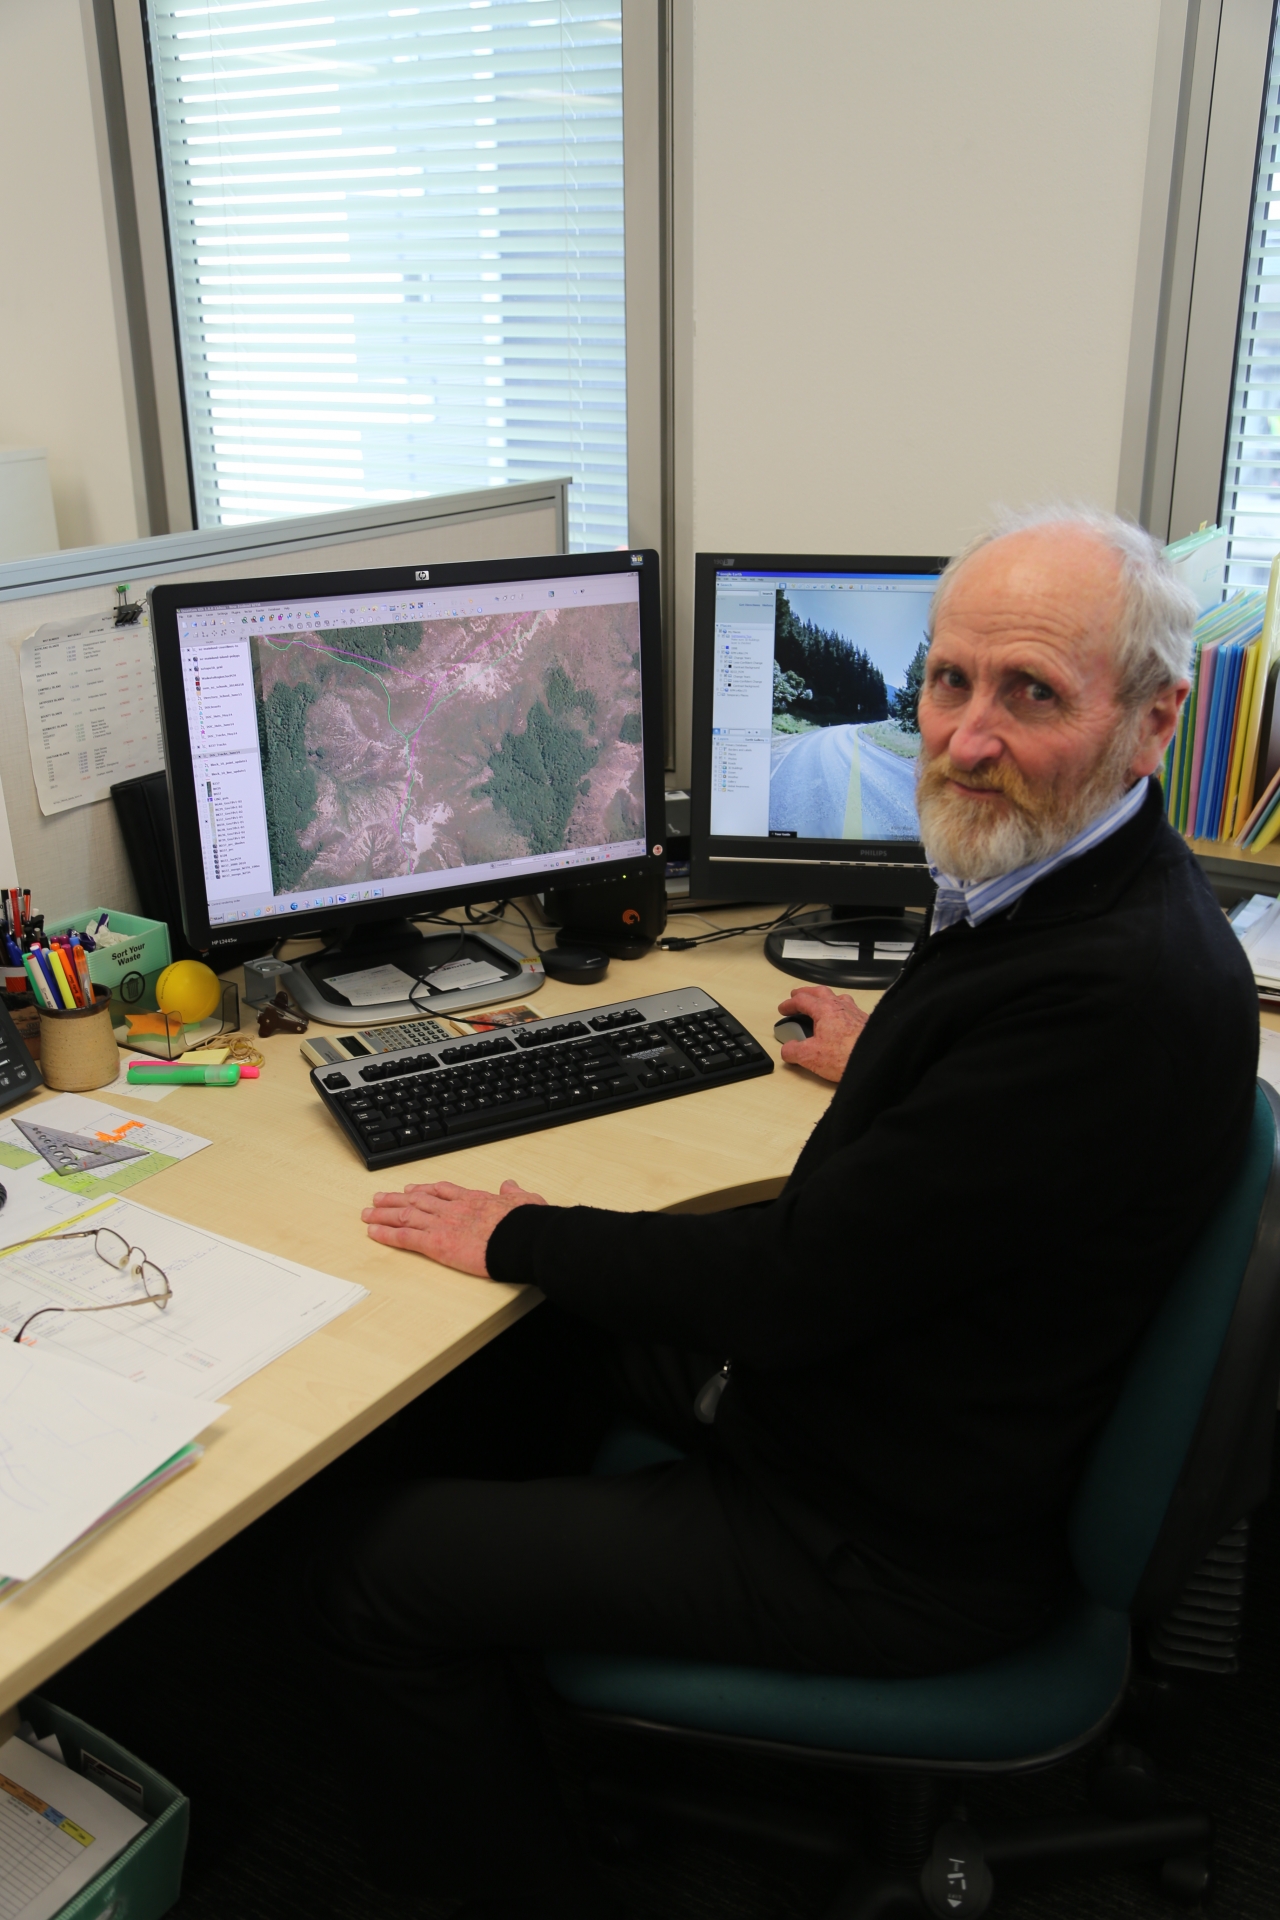
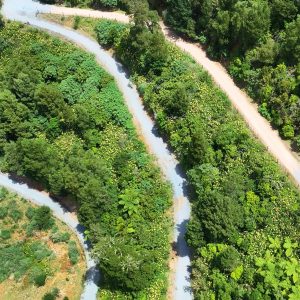
Even before the age of Pong* and 404 error messages, map makers were able to draw lines representing the height of every square metre of New Zealand. Matthew Pike asks how on earth this was possible. I love maps. I always have, ever since I was six-years-old and would sit on the back seat of […]
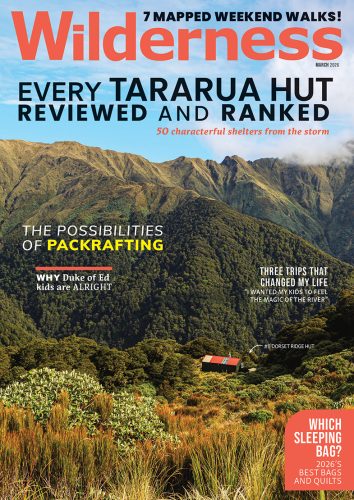
Each issue of Wilderness celebrates Aotearoa’s great outdoors — written and photographed with care, not algorithms.Subscribe and help keep our wild stories alive.