Maps are printed in two dimensions (2D), but the land they represent is in three dimensions (3D). How can a 2D map allow you to visualise the 3D land shape?
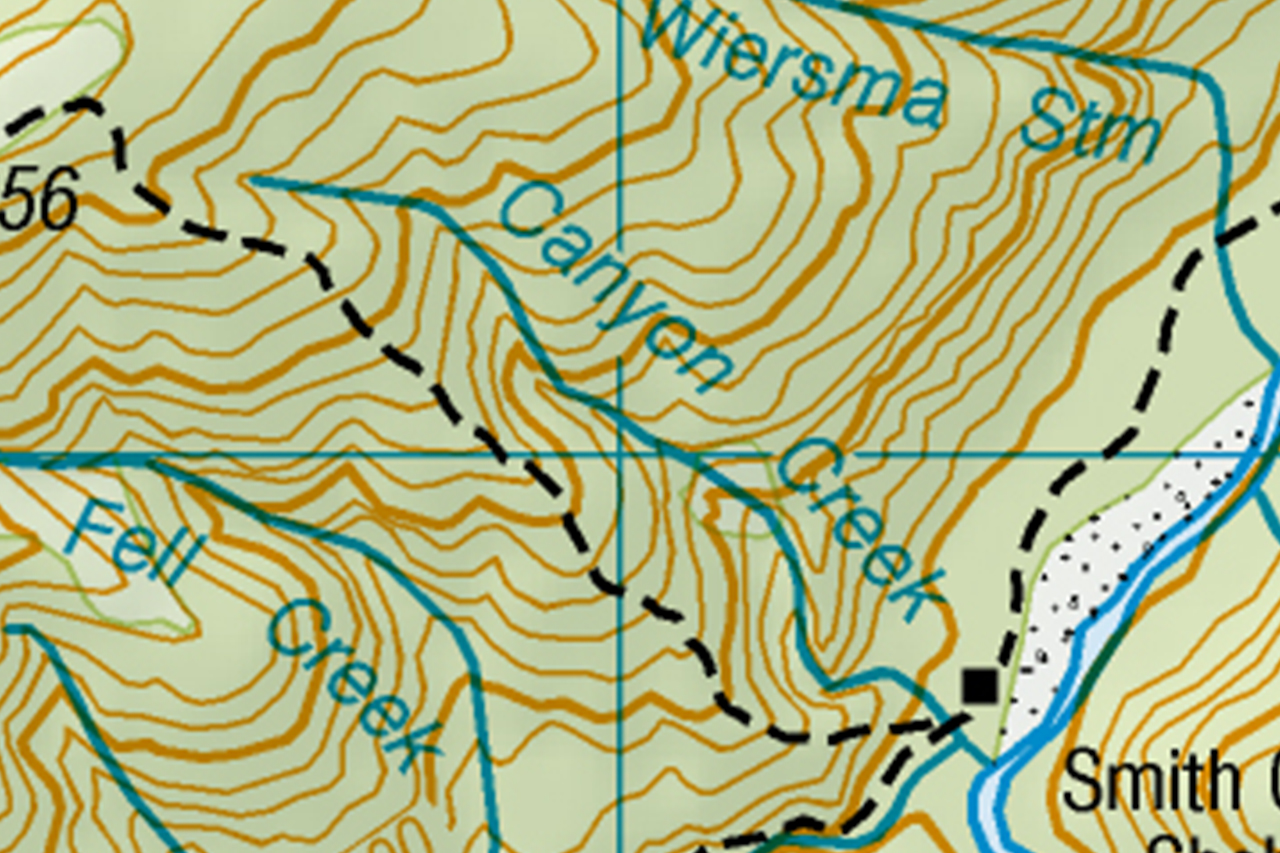
The coastline on Topo50 maps represents the mean high-water level. Contour lines are the orange/brown lines on the map that indicate the 3D shape of the land inside the coastline. In time you will be able to use these to picture the map as a 3D image.

Contour lines
Contour lines indicate height above mean sea level at a set distance. On the Topo50 map series, contour lines are 20m in altitude apart, and every fifth contour line is darker. These darker lines are 100m apart. Somewhere along these darker lines you will find a number – 100, 200, 300 etc – that indicates the line’s height above mean sea level.

Steepness
A slope will be steepest when contour lines are close together, and less steep when they are further apart. It is easy to think that if you walked exactly along a contour line it would be perfectly flat but that may not be the case, as there could be hills up to 19m high on the contour.
Tracks that sidle a hill or follow a river often approximately follow a contour line. Any streams flowing down the hillside must be in a hill’s low points. Each time you cross a stream you will climb down to it and then back up. These climbs may be under 19m and not show as a contour line.

High points
Contour lines sit in a nest with each successive line 20m higher than the outer line. At the top is a circle or oval in which the high point sits less than 20m above the final contour line. This may not be at the centre. The high point may be shown by a dot and a number representing height above sea level.
Relief shading
Green areas indicate bush, but there are darker shades of green in places. The same is true for other blocks of colour. This is due to the relief shading map-makers have used to assist us to visualise the terrain. The shading is done as if the sun is shining from the north-west. This helps the features on the map to stand out as if in 3D.

Gullies and spurs
Bigger streams are shown in blue. These flow down hillsides, eroding the land and forming gullies with higher ground on either side. This affects the contour lines, and streams that sit in upside-down ‘Vs’ indicate gullies. The water flows from the point or bottom of the ‘˄’ to the mouth or top of the ‘˄’. The narrower the ‘˄’, the deeper the gully.
Any ‘˄’ in the contour line indicates a gully where water will flow following sufficient rainfall. However, there may not be a permanent stream there, and some permanent streams are not shown by a blue line.
Spurs are the higher land between two streams. Spurs are shown by V-shaped contour lines. In a river valley, the foot of each spur creates an obstacle that the river has to bend around. The gullies create a bend in the other direction, so the river has an ‘S’ shape.
Practise
Take a map to a place where you can look at a hillside – it doesn’t matter if it’s covered in bush or is open farmland. Orientate the map so it is facing the hillside. Look on the hillside for the streams that are marked on the map. You might not be able to see the stream itself but you will be able to see the shape of the gully it lies in. Look at the shape of the stream and the number of forks. See how these match the map. Then note that between each stream there is a spur. Look at the shape of these spurs and compare them to the map.
With the hill in front of you in 3D, look at the map and see if you can see the 3D image from the lines on the map. This will come with practise.
Heather Grady is an instructor with Outdoor Training New Zealand