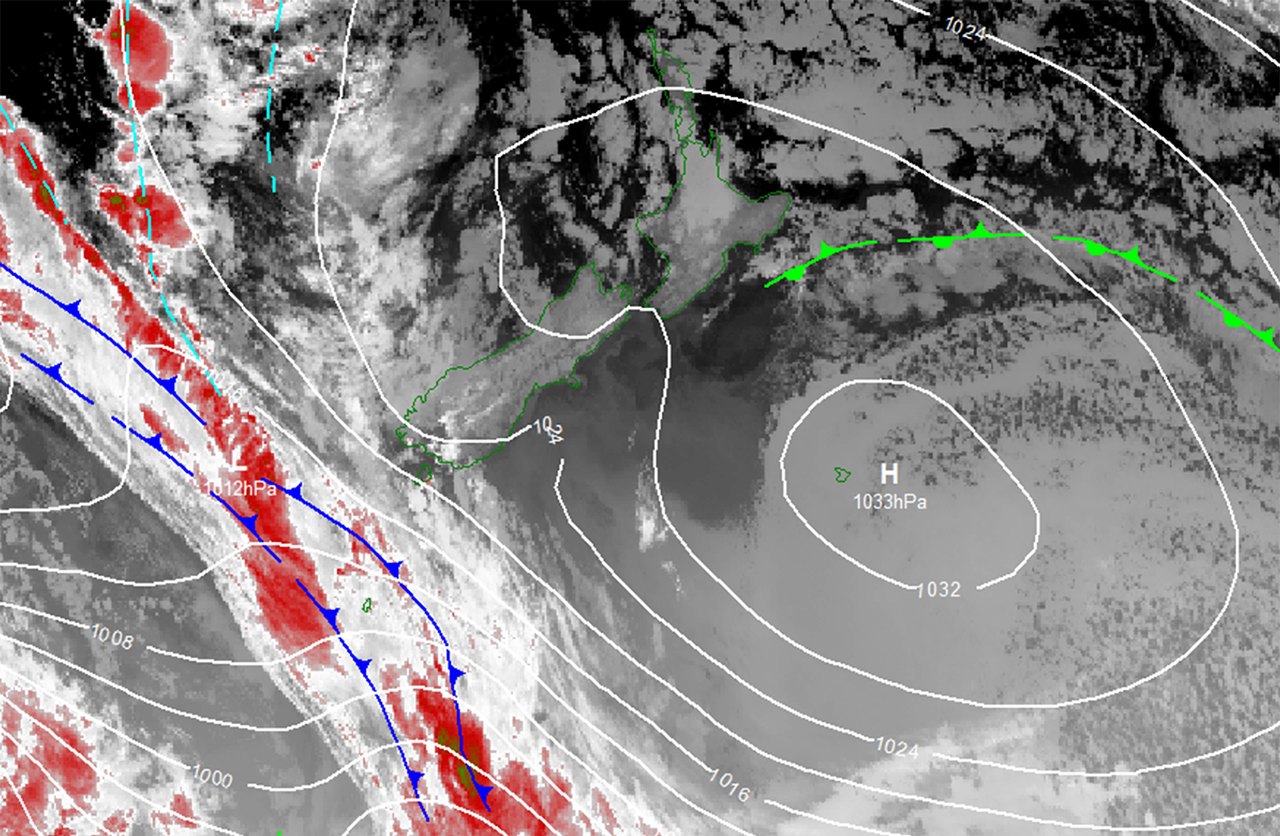
Isobars
The lines on a weather chart are known as isobars. They show areas of equal pressure and give meteorologists an indication of wind direction and strength.
Charts also show pressure systems, with an ‘H’ for high and an ‘L’ for low. In the Southern Hemisphere, the flow is clockwise around the low-pressure systems, and anticlockwise around the high-pressure systems. Low-pressure systems typically mean inclement weather.
When you’re trying to discern a prediction from a weather chart, “locate areas of high and low pressure, which will allow you to get a sense of how the air is moving,” Doolin advises. “The more tightly packed the isobars are, the stronger the wind is,” he said, adding that at higher altitudes, the wind strength increases.
Fronts
Also featured on a weather chart are fronts (also known as troughs or convergence zones). Fronts are the boundaries between air masses and appear on the map as a line with triangles or semicircles. Cold fronts are marked by triangles, while warm fronts are semicircles. An ‘occluded’ front is a combination of triangles and semicircles, which means a cold front is overtaking a warm front, with the symbols on the same side of the line as the direction of the front. In an occluded front, warm air can become trapped above the cold front, and where it cools, dense cloud and rain form.
Triangles and semicircles on the same line but pointed in opposite directions mean a stationary front, which can take a long time to pass; any rain clears slowly and temperatures and pressure levels are slow to change.
Ridges and cols
Other things to look for are ridges and cols, which on the chart often look like a tongue extending from the high-pressure centre. The weather in a ridge is an extension of the weather in the high system. A col is the area between two neighbouring pressure systems, which typically contains either fog or thunderstorms.

No previous post found.
34 years of inspiring New Zealanders to explore the outdoors. Don’t miss out — subscribe today.

Questions? Contact us