Map reading is a crucial backcountry skill. Understanding the information contained in a topo map will help you to plan and execute your trips.
New Zealand’s 1:50,000 scale topographic maps are the most detailed maps available for the backcountry. With a refined combination of colour, contour and symbology, these maps convert the three-dimensional world into two dimensions, providing a comprehensive illustration of the terrain and its features, both natural and cultural. Despite digital mapping options becoming more widely available, paper maps remain a key navigational aid and provide an overview that cannot easily be matched by screens.
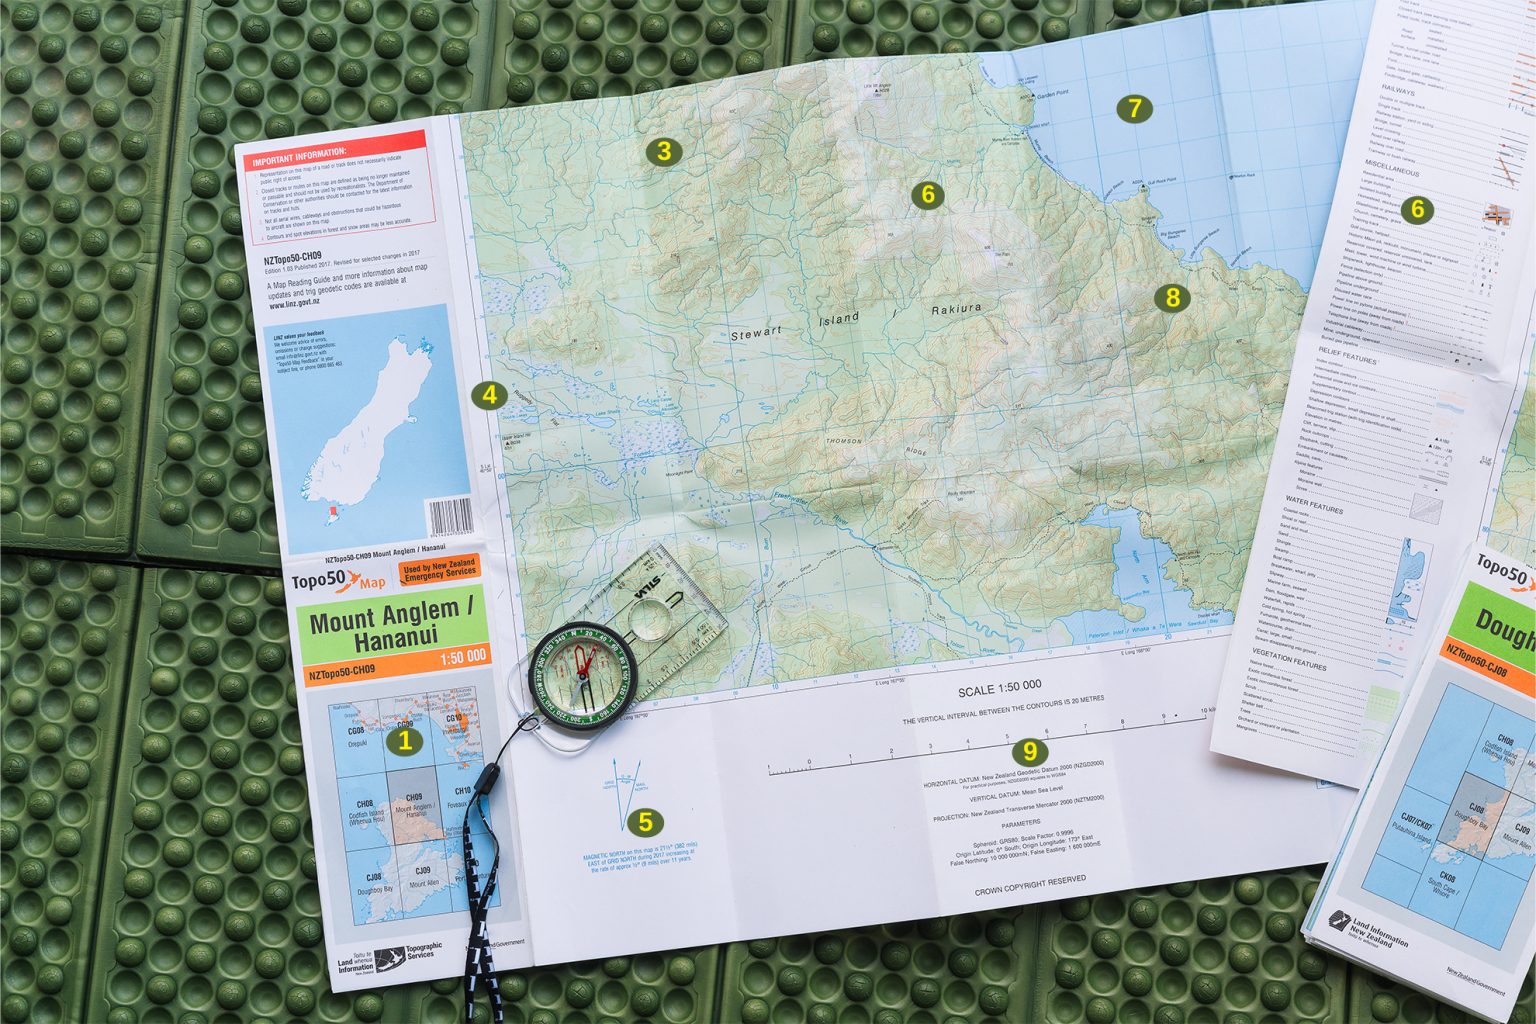
1 Cover and back panel
The cover shows the sheet’s name and number, and a grid that indicates the map’s neighbouring sheets. The back panel locates the map within the country, and provides its title, edition and the year it was released. Always use the most recent edition when planning a journey.
2 Datum and projection information
The New Zealand Geodetic Datum (2000) is the official geodetic datum for New Zealand and aligns closely with the international standard. This reference framework provides a standardised way to determine and express geographic coordinates across the country. When using a GPS, ensure it is set to a compatible datum for the map being used, for consistent coordinates.
Projection is the method of presenting the curved surface of the Earth on a flat map. It specifies how to convert geographic coordinates (latitude and longitude) from a datum into planar or grid coordinates for mapmaking. New Zealand currently uses the NZTM2000.
3 Relief shading
Shading provides another visual clue to the terrain by creating a three-dimensional appearance. Hills and valleys are shaded as if they were illuminated from the northwest.
4 Map coordinates
Coordinates are provided along the map face edge in two formats: geographical (latitude/longitude) in degrees and minutes, and grid coordinates (easting/northing) in metres. Six-figure grid references are most commonly used when sharing coordinates with others, in the form of ‘Map format (e.g. Topo50), map number, XXXYYY’, where X is the easting, read off the top or bottom of the map, and Y is the northing, read from the sides. There is an instruction panel for grid references in the map margin.
5 North point diagram
This diagram expresses the difference, in degrees, between grid north (the map grid) and magnetic north (where the compass points). This value is the grid/magnetic angle (sometimes called declination) and changes over time depending on your location. Grid/magnetic angle must be accounted for to enable accurate bearings when a compass is used with a map.
6 Map face and legend
An individual map, sometimes called a sheet, shows topographic information that describes the land’s natural features along with cultural features such as huts, bridges, buildings and roads.
The legend, found in the margin, explains the symbols employed on the map. The use of colour follows international conventions: green for vegetation, black for man-made features and blue for water features. Many symbols are self explanatory, and details as small as fences, greenhouses and historic signposts may be indicated.
7 Map grid
New Zealand topo maps are printed so that grid north points to the top of the map. The vertical grid lines run north–south (eastings); the horizontal ones west–east (northings). A single grid square on a modern Topo50 map represents 100ha or one square kilometre, which allows a quick and simple estimation of area or distance.
8 Contour lines
Contour lines are the key feature setting topographical maps apart from other maps. Contour lines provide a rendering of a three-dimensional environment in two dimensions by linking points of equal height. The vertical distance between contour lines on a 1:50,000 scale Topo50 map is 20m, and every 100 vertical metres is indicated with a darker line, which also has the elevation marked on it. Lines close together indicate steep terrain; those further apart represent gently sloping or flat ground. Once you become accustomed to interpreting contour lines, it’s easy to visualise the terrain they represent.
9 Scale
On a 1:50,000 topo map, 1cm represents 500m (50,000cm) on the ground.
The scale bar displays 1km increments from 0–10, with a 100m scale left of 0. You can use this to measure between features to get a sense of their size.
Tip: Use a piece of string or paper to measure distance on the map before comparing it to the scale, but remember that elevation gain or loss will increase the actual distance.